Diagrama de Gantt y Cascada Gantt Chart & Waterfall
La Línea Base Congelada The Frozen Baseline
Visualizando el Modelo Predictivo Visualizing the Predictive Model
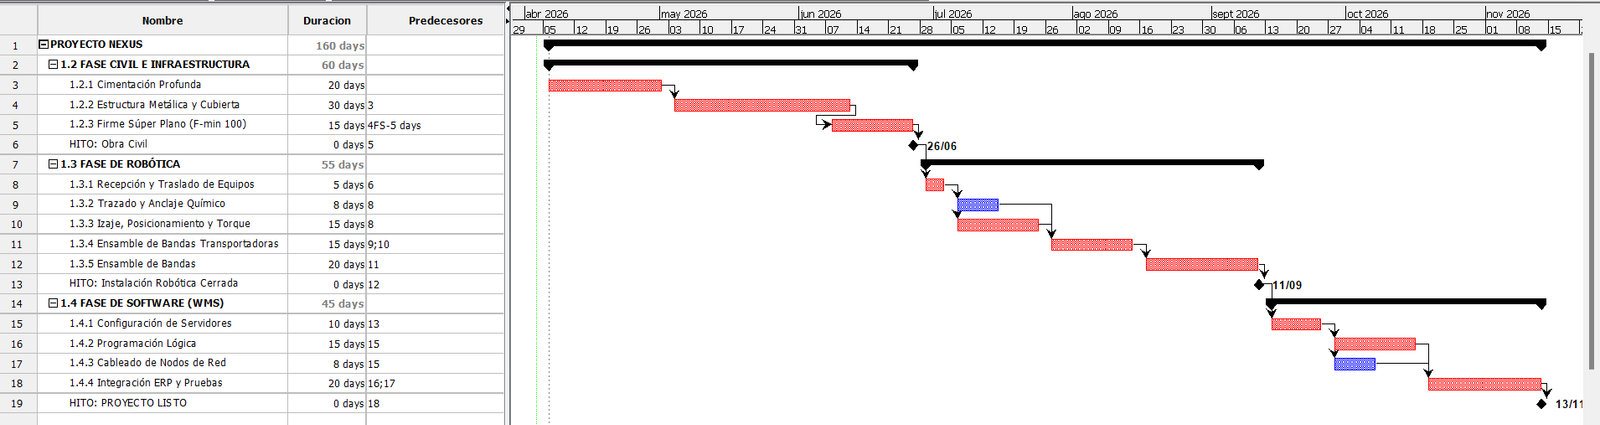
El Diagrama de Gantt es la consolidación final de los Procesos 8, 9 y 10. Cruza las actividades del proyecto (eje Y) con una escala de calendario (eje X). Una vez que el patrocinador de SR Consulting aprueba este modelo, las barras quedan "congeladas" y se convierte oficialmente en la Línea Base del Cronograma.
The Gantt Chart is the final consolidation of Processes 8, 9, and 10. It crosses project activities (Y-axis) with a calendar scale (X-axis). Once the SR Consulting sponsor approves this model, the bars are "frozen" and it officially becomes the Schedule Baseline.
📑 Tareas de Resumen (Fases) Summary Tasks (Phases)
Son las barras negras con puntas en los extremos. Representan una Fase del Proyecto o un Entregable Mayor. Su duración se calcula automáticamente sumando las tareas que tiene por debajo. Esto es lo que crea el efecto visual de "Cascada".
These are the black bars with pointed ends. They represent a Project Phase or a Major Deliverable. Their duration is automatically calculated by summing the tasks below them. This is what creates the visual "Waterfall" effect.
🔗 Dependencias (Links) Dependencies (Links)
Las flechas que conectan las barras no son decorativas; son código matemático. Representan la Relación Fin-Inicio (FS). Si la barra predecesora se retrasa, la flecha empuja automáticamente a la sucesora, recalcuando todo el cronograma.
The arrows connecting the bars are not decorative; they are mathematical code. They represent the Finish-to-Start (FS) Relationship. If the predecessor bar is delayed, the arrow automatically pushes the successor, recalculating the entire schedule.
♦️ Hitos (Milestones) Milestones
A diferencia de una actividad, un hito tiene duración cero (0 días). Es un rombo de control que marca una entrega crucial. Los directivos monitorean hitos, no actividades diarias.
Unlike an activity, a milestone has zero duration (0 days). It is a control diamond marking a crucial delivery. Executives monitor milestones, not daily activities.
🚨 La Ruta Crítica The Critical Path
Las barras en rojo tienen Holgura Cero. Forman el camino más largo del proyecto. Un solo día de retraso en una barra roja retrasará la fecha de entrega final estipulada en el Project Charter.
The red bars have Zero Float. They form the longest path of the project. A single day of delay on a red bar will delay the final delivery date stipulated in the Project Charter.
Documento Oficial: Gantt Chart Integrado (Proyecto Nexus) Official Document: Integrated Gantt Chart (Project Nexus)